
MONIT
Complete monitoring on your own dedicated VM.
Servers, websites, network flow, syslog and 74 sensor types — collected by local and remote probes, visualised on drag/drop dashboards and wallboards, with multi-channel alerting and public status pages.
WHY MONIT
Built for MSPs who got tired of per-sensor billing.
01
Your Own Dedicated VM
Every customer runs on an isolated virtual machine — full performance, your data only, no noisy neighbours.
02
Local & Remote Probes
Monitor across sites and VPN tunnels with lightweight probes. Outbound-only HTTPS — no inbound firewall holes.
03
74 Sensor Types
Sensors across 13 categories: ping, HTTP/S, SNMP, SSL, services, databases, disk, and more — every one a real check.
04
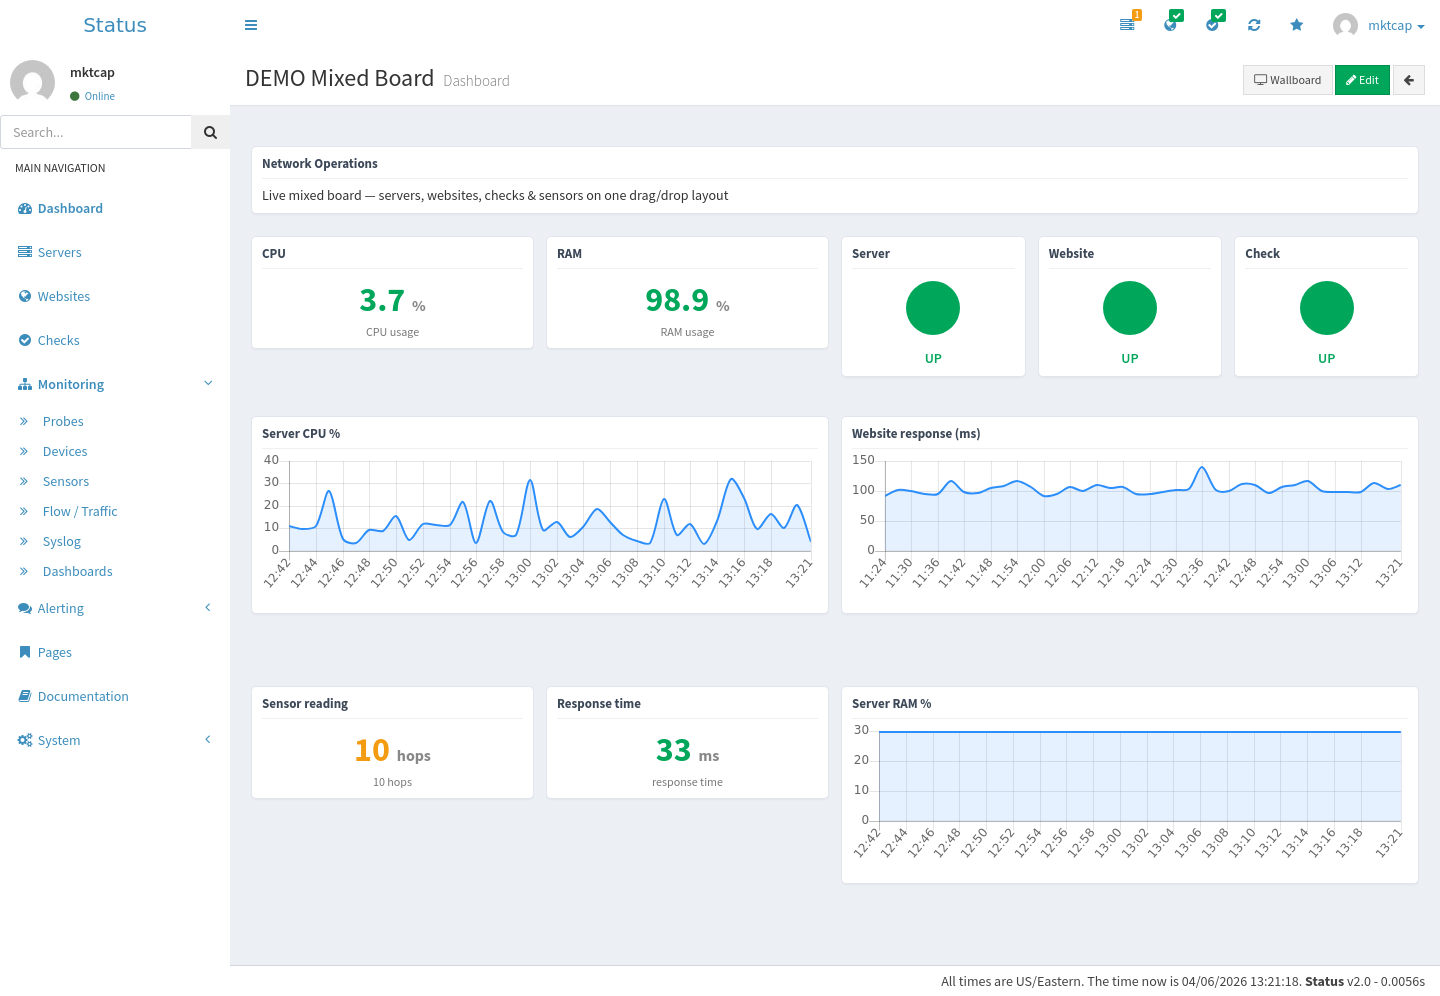
Dashboards & Wallboards
Build drag/drop layout boards mixing graphs, readings and status tiles. Share public links or run a fullscreen office wallboard.
05
Multi-Channel Alerts
Email, SMS, Pushover, Pushbullet, webhooks and escalation policies — route alerts however your team works.
06
Public Status Pages
Branded, shareable status pages so your clients can see uptime at a glance — on your own domain.
PRICING
Simple, aggressive pricing.
Hosted on a dedicated VM, all features included. No add-on tiers, no surprise fees — just pick the size you need.
100 DEVICES
$49
per month
Up to 100 devices
200 DEVICES
$89
per month
Up to 200 devices
300 DEVICES
$119
per month
Up to 300 devices
400 DEVICES
$139
per month
Up to 400 devices
500 DEVICES
$159
per month
Up to 500 devices
Per-device discounts are measured against the 100-device rate of $49 for 100 devices, which works out at $0.49 per device per month. At 500 devices you pay $0.32 per device instead. These are list prices for the hosted service, not a comparison against any other vendor.
Need more than 500 devices? Contact us for enterprise pricing.
Ask about Monit →FEATURES
Comprehensive monitoring, all included.
Probes & Sensors
- Local (central) probe plus remote probes at client sites
- 74 sensor types across 13 categories — all live checks
- Device / sensor / channel model with metric channels
- SNMP v1/v2c monitoring with thresholds
- On-probe ping, traceroute, DNS & TCP diagnostics
- Pause/resume, masked credentials, never logged
Servers & Websites
- Agent-based Linux & Windows server monitoring
- CPU, memory, disk, network, load & uptime
- Service and hardware RAID status tracking
- Website uptime, response time & status codes
- SSL certificate expiry monitoring
- Content validation with search strings
Network Visibility
- NetFlow v5 flow / traffic collection & aggregation
- Top talkers, protocols, ports and conversations
- Syslog receiver with severity / keyword / source filters
- TCP, UDP, ICMP ping and DNS validation checks
- IP blacklist (RBL) reputation monitoring
- Listener health and packet/flow counters
Dashboards & Alerts
- Drag/drop dashboards over any monitored data
- Public dashboards and fullscreen wallboards
- Multi-channel alerting with escalation
- Occurrence-based triggers to avoid false alarms
- Webhook & external-script callbacks for automation
- 30-day history and trend analysis
SENSORS
All 74 sensor types.
Every sensor runs a real check — full metrics where possible (local, SNMP, HTTP, SQL, SSH) and genuine protocol / reachability probes for the platforms you point them at — across 13 categories.
Availability / Network
Ping / ICMP
Host / IP
TCP Port
Host / IP · Port
UDP Port
Host / IP · Port
HTTP
URL
HTTPS
URL
HTTP Content Match
URL · Expected Content
HTTP Transaction
URL
SSL Certificate Expiry
Host / IP · Port · Warn (days)
SSL/TLS Security Check
Host / IP · Port
DNS
Host / IP
REST / JSON API
URL
Traceroute Hop Count
Host / IP · Warning threshold
QoS / Jitter
Host / IP · Warning threshold
Port Range Scan
Host / IP · Ports (comma-separated)
SNMP / Hardware
SNMP Custom (GET OID)
Host / IP · Port · SNMP OID (optional override) · SNMP Version · SNMP Community · Warning threshold · Critical threshold
SNMP System Uptime
Host / IP · SNMP Version · SNMP Community
SNMP Interface Traffic
Host / IP · SNMP OID (optional override) · SNMP Version · SNMP Community
SNMP CPU
Host / IP · SNMP Version · SNMP Community · Warning threshold · Critical threshold
SNMP Memory
Host / IP · SNMP Version · SNMP Community · Warning threshold · Critical threshold
SNMP Disk / Storage
Host / IP · SNMP Version · SNMP Community · Warning threshold · Critical threshold
SNMP Temperature
Host / IP · SNMP Version · SNMP Community · Warning threshold · Critical threshold
SNMP UPS / Battery
Host / IP · SNMP Version · SNMP Community · Warning threshold
SNMP Printer
Host / IP · SNMP Version · SNMP Community
Dell iDRAC (SNMP)
Host / IP · SNMP Version · SNMP Community
IPMI Hardware Health
Host / IP · Port
Windows (WMI / WinRM)
WMI CPU Load
Host / IP · Port
WMI Memory
Host / IP · Port
WMI Disk Free
Host / IP · Port
Windows Service
Host / IP · Service / Process / Container
Windows Event Log
Host / IP · Query / Command
Windows Updates
Host / IP
WinRM Script
Host / IP · Approved Script Name
Performance Counter
Host / IP · Query / Command
Linux / Unix (SSH) & Local
CPU / Load (local)
Warning threshold · Critical threshold
Memory (local)
Warning threshold · Critical threshold
Disk Usage (local)
Path · Warning threshold · Critical threshold
systemd Service (local)
Service / Process / Container
Process (local)
Service / Process / Container
SSH Load Average
Host / IP · Username · Warning threshold
SSH Disk Free
Host / IP · Username · Path
SSH Command / Script
Host / IP · Username · Query / Command
Virtualization
Docker Container (local)
Service / Process / Container
Proxmox Node / VM
Host / IP · Port
VMware Host (API)
Host / IP · Port
VMware VM (API)
Host / IP · Port
Hyper-V (WinRM)
Host / IP · Port
Kubernetes API
Host / IP · Port
Database
MySQL / MariaDB
Host / IP · Port · Username · Password · Database · Query / Command
PostgreSQL
Host / IP · Port
Microsoft SQL Server
Host / IP · Port
Oracle
Host / IP · Port
MongoDB
Host / IP · Port
Redis
Host / IP · Port
Cloud / SaaS
AWS Service Health
URL
Azure Service Health
URL
Microsoft 365 Health
URL
Google Workspace Health
URL
Web / Application
LDAP
Host / IP · Port
RADIUS
Host / IP · Port
SIP OPTIONS
Host / IP · Port
Web Transaction
URL
SMTP
Host / IP · Port
IMAP
Host / IP · Port
POP3
Host / IP · Port
SMTP + IMAP Reachability
Host / IP
Messaging / IoT
MQTT
Host / IP · Port
File / Storage
File Exists / Age
Path
Folder Size
Path
SMB Share Reachability
Host / IP · Port
Environment / Sensors
Temperature (SNMP)
Host / IP · SNMP OID (optional override) · SNMP Community · Warning threshold · Critical threshold
Humidity (SNMP)
Host / IP · SNMP OID (optional override) · SNMP Community
Power / PDU (SNMP)
Host / IP · SNMP OID (optional override) · SNMP Community
Custom
Custom Script (local, approved)
Approved Script Name
Custom REST Value
URL
COLLECTORS
Flow & syslog collectors.
Beyond per-target sensors, every probe can also run network-wide collectors and receivers — so a single instance covers metrics, traffic flow and log streams together.
Flow / Traffic Collector
- Top talkers, protocols, ports & conversations
- Per-collector byte / packet / flow totals
- Listener health and last-packet tracking
Syslog Receiver
- Severity, facility, host & keyword filtering
- Parsed live message stream with source attribution
- Listener health and last-message tracking
SCREENSHOTS
See it in action.
Click any screenshot to enlarge. Every view is from the live platform.
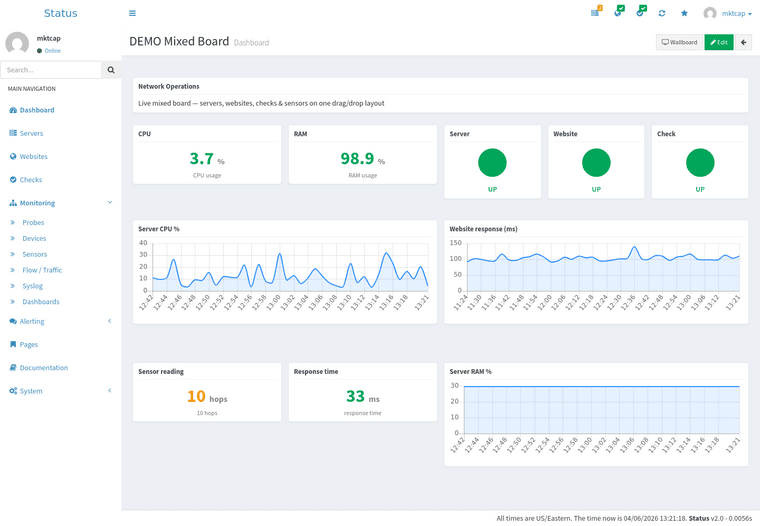
Custom Dashboard
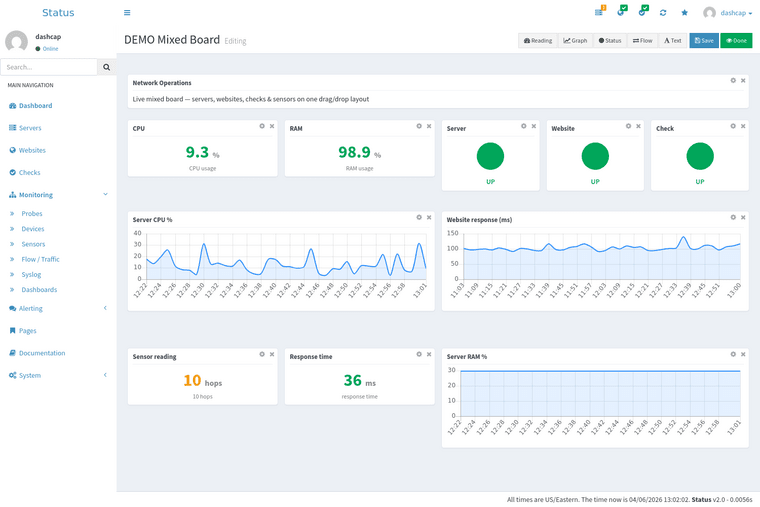
Drag & Drop Builder
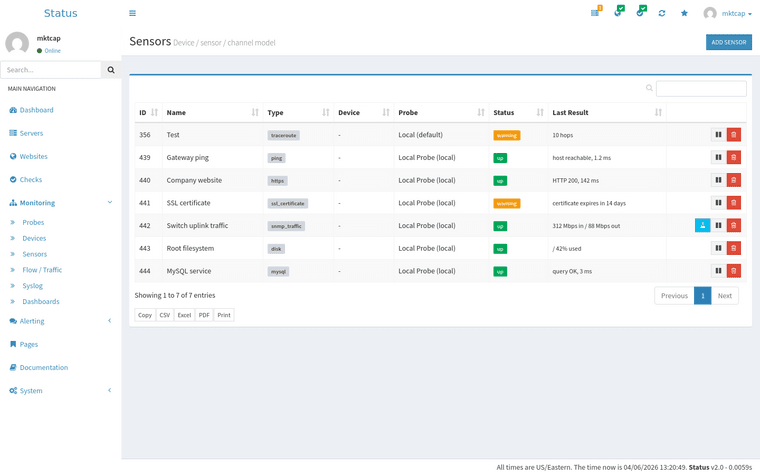
Sensors
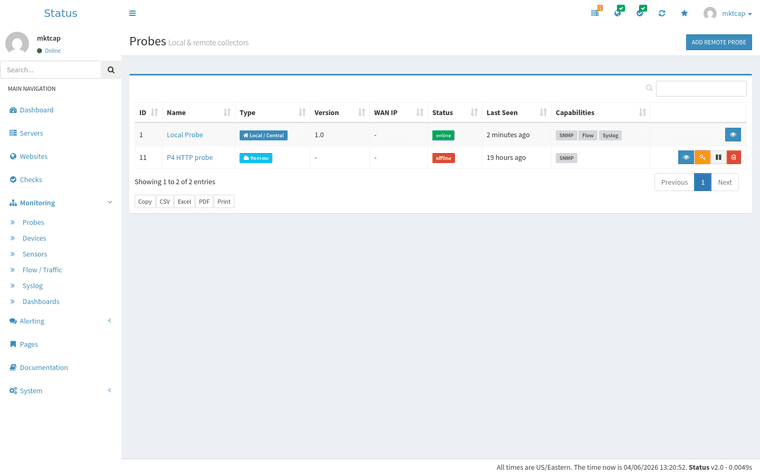
Local & Remote Probes
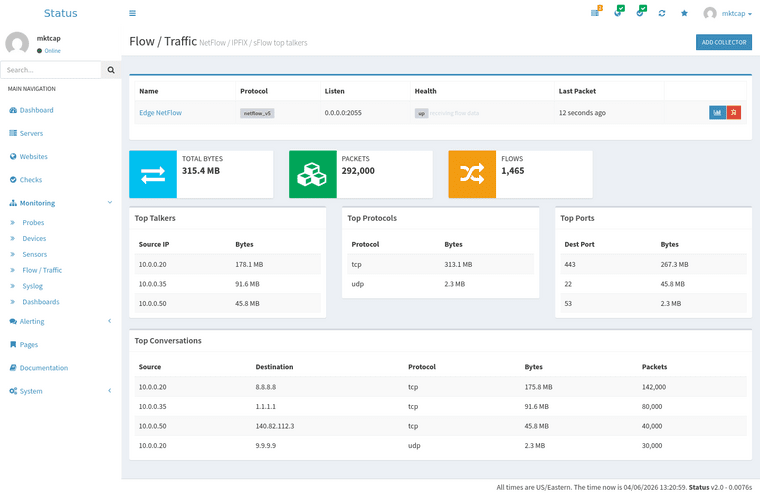
Flow / Traffic (NetFlow)
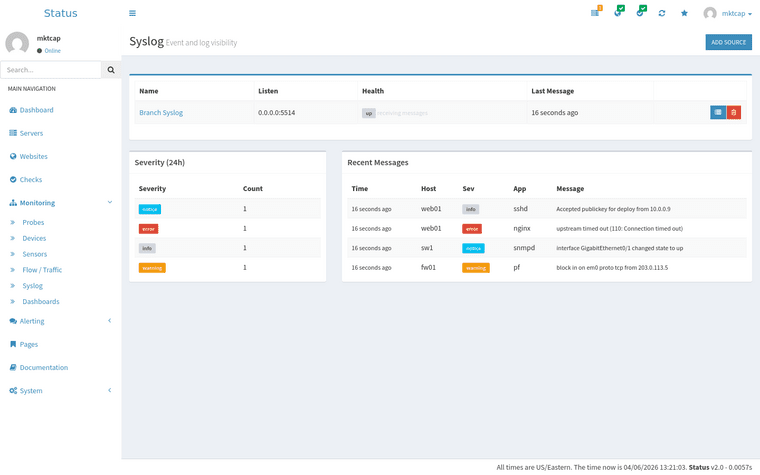
Syslog
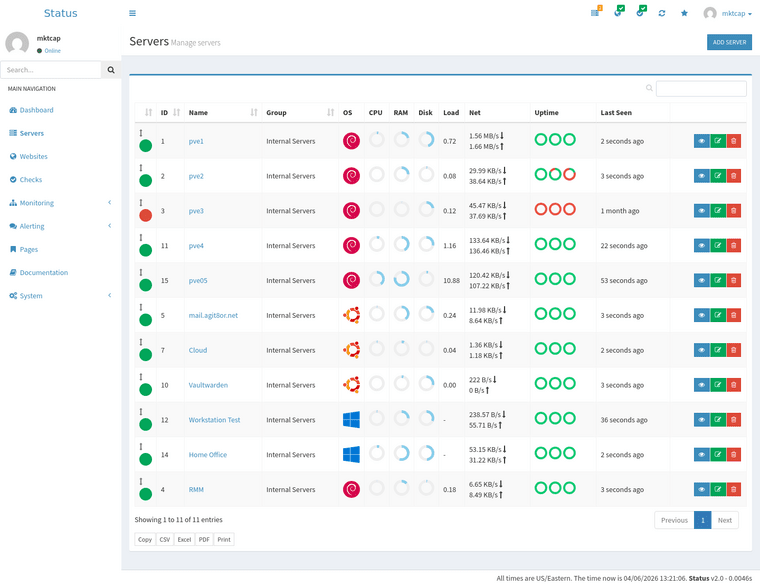
Server Monitoring
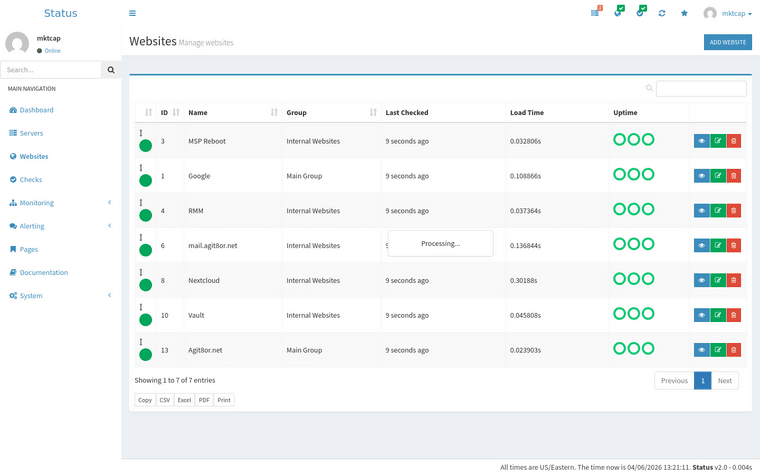
Website Monitoring
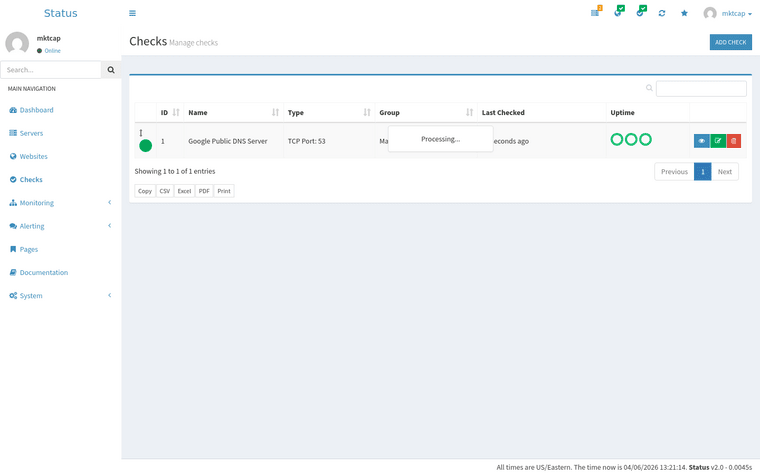
Custom Checks
GET STARTED
Ready to deploy Monit?
Questions about pricing or features? Get in touch to discuss your monitoring needs and get a custom quote. For the technical detail of how it is built and delivered, read the Monit engineering case study.
What to expect
- Free consultation to discuss your monitoring requirements
- Custom quote based on your device count and needs
- Dedicated VM provisioned within 24-48 hours
- Full setup and configuration included
- Training on using the platform
- Ongoing support and updates included